Introduction
Visibility is a common problem that teams often struggle with. As a superintendent or project manager, how often have you come across an issue that wouldn’t even be one had it been caught before? Or how many times have you faced a mountain of information that needs hours of work to be deciphered? And what’s worse is that almost every major hurdle or rework on the jobsite is directly or indirectly affected by this data. The answer to a supposedly colossal problem is simple: construction data analytics.
Data analytics in construction is the key to utilizing information quickly, in the right way, and without additional hassles. In this guide, we look at what it means, how it functions, and the direct impact it creates on the construction site. Continue reading to find out more!
Key Takeaways
- Most construction sites generate huge amounts of information, but much of it remains static since it’s scattered, disorganized, and unstructured.
- Construction data analytics converts project information into actionable insights that help teams make faster, smarter decisions.
- According to studies, rework is largely a data problem caused by the late detection of issues.
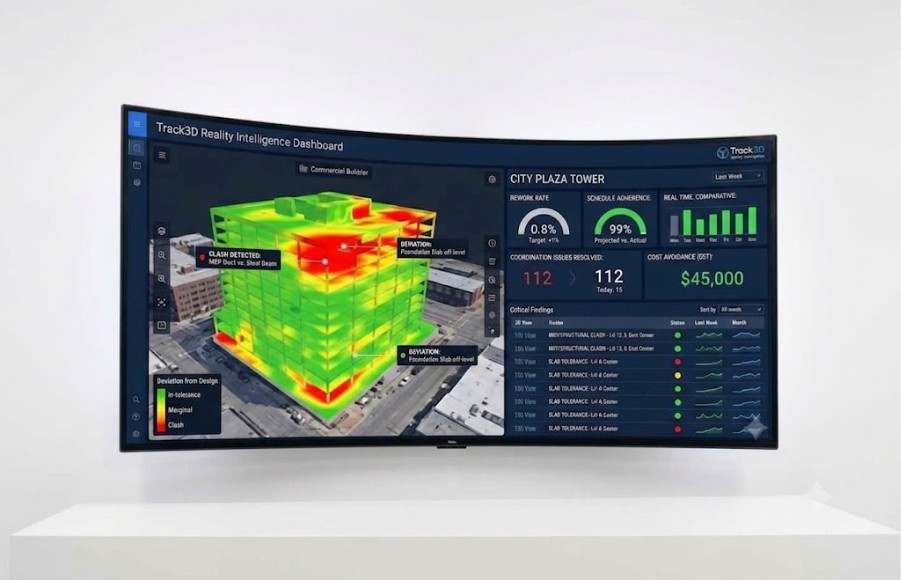
- Data analytics works by capturing site data, comparing it with design models, and visualizing discrepancies.
- Early detection of issues between planned and as-built conditions helps reduce rework.
- An apt construction analytics solution should provide fast insights, contextual model comparisons, and easy adoption for field teams.
What Is Construction Data Analytics?
Data analytics in construction is the process of collecting, organizing, and interpreting project data to generate actionable insights that help teams make smarter decisions, catch problems early, and keep builds on track and on budget. Simply put, it means turning enormous volumes of information into something that the teams can actually use. But why is this such a big deal? After all, information is information, right? Not really.
With the advent of digitization, every active project site generates data constantly, from reality capture tools, BIM models, site photos, RFIs, punch lists, schedule updates, inspection reports, etc. But most of this data just sits in folders or personal devices since it’s not organized. Information that isn’t connected or analyzed on time is of practically no use. So when teams actually need data to make better decisions or take informed steps, they have nothing to base them on.
This is where construction data analytics come into the picture. It brings all the data together, applies logic and comparison, and generates insights that the teams need to act on. At the end of the day, smart and organized data is what’s going to become a powerful tool that puts you ahead of the competition. Track3D is built around this important distinction.
Why Is Rework a Data Problem?
Before we proceed to the applications of data analytics in construction and its business value, let’s take a quick detour to understand why it’s so crucial in the first place. The answer lies in rework. Studies show that 9 out of 10 projects go over budget, and about 75% miss their deadlines – all because of rework. Clearly, it is one of the biggest hurdles the construction industry is facing and can’t seem to get around. But how is rework linked to data analytics in construction?
According to research published by Premier Construction Software, the construction industry fails to use 96% of the data it generates. This is where rework hides. Most people assume rework is a field problem. However, rework occurs due to the lack of organized data. When issues are discovered late in the project cycle, the same work needs to be done twice. Eventually, the downstream effects multiply – subcontractor claims, schedule compression, material waste, and client dissatisfaction. Thus, rework ends up costing nearly twice the money, and much more in terms of time, resources, and business integrity.
As aforementioned, the root cause is informational, not operational. Field teams continue building and working on the project, but no one actually verifies if it’s going according to plan. Data is collected in huge amounts, but because it’s all over the place, no one is actually analyzing it to generate insights. Without organized data, verification happens through walkthroughs, anecdotal progress updates, and periodic site photos, none of which is fast enough to catch issues before they turn into rework.
Thus, construction data analytics can resolve this. It builds a strong feedback loop that helps teams identify problems as soon as they occur and when there’s still plenty of time to correct them.
How Does Construction Data Analytics Work in Practice?
In this section, we look at how construction data analytics actually functions. The process is quite straightforward:
- Data Capture: Step 1 is basically an extension of reality capture. 360-degree cameras, laser scanners, or photogrammetry tools collect visuals and information of as-built conditions from the jobsite to create a digital record of what exists on the field at any given day.
- Data Processing: The tool processes the captured data with the design model (BIM or 2D drawings) with software applications. It identifies discrepancies automatically, and makes it digitally accessible.
- Insight Generation: Once processed, the data is turned into a meaningful and actionable report that the team can understand and act on.
- Decision-Making and Action: Once the team receives clear, time-stamped data, they can make informed decisions and take better actions. Flagging concerns, assigning follow-ups, and resolving documentation becomes much easier.
Features of a Good Data Analytics Solution for Construction
A field as dynamic as construction demands specific attributes from digital tools. Thus, not all data analytics tools are well-suited for construction. To find the most effective ones, you need to look for these critical traits:
- Speed of Insight: The best way to avoid rework is to spot issues as soon as they occur. Thus, you need a tool that not only generates a high volume of data but also prioritizes the speed of generation. For instance, weekly reports are good, but a platform that flags issues within 24 to 48 hours of capture is much better.
- Contextual Comparison: Merely creating a digital archive is not enough. It only draws value when this archive can be consistently compared with the BIM, drawing plans, or original intent, and discrepancies can be flagged – automatically and at scale.
- Ease of Use: Construction is predominantly an on-field job. Hence, teams are bound to feel some hesitation or resistance against digital tools. As the superintendent or project manager, it is important to keep this in mind while choosing them. Those that are the easiest and most convenient to use will be adopted by the team the fastest.
Track3D is built around all three of these major prerequisites. Our platform is designed for construction professionals who need clarity quickly. Scan data is compared against the model, and findings are visualized clearly, so the whole team, from the office to the site, stays on the same page.
Common Situations Where Data Analytics Prevent Rework
The distinction between damage control and risk prevention matters the most when the window of action is small. And every construction team has faced these situations, some of which are listed here, along with why they are important:
- Structural to MEP handoffs: Clearances and penetrations must be verified before finishes.
- Foundation and slab work: Early tolerance issues can turn into major structural problems.
- Facade and curtain wall installation: Alignment must be checked on a larger scale before anchoring.
- Interior fitout sequencing: Trades depend on earlier work being precisely placed.
- Pre-pour inspections: A final scan comparison against the rebar and formwork design can catch issues before concrete sets.
Even though the window of action is narrow, construction data analytics can extend it by surfacing problems earlier. And this is exactly what Reality Intelligence is designed for. Because rework may not be inevitable, but it is a symptom of a data gap between the field and the office. By recognizing it accurately and ensuring that teams address it, it can be avoided to a large extent.
The Business Value: A Use Case Scenario
Before wrapping up, we look at a direct application of data analytics in construction and the business value it generates. Consider a large commercial build in the structural phase. Multiple trades are simultaneously working across twelve floors – structural steel, MEP rough-in, and concrete pours are all happening at the same time. But each of them depends on the others being done exactly right.
At a conventional construction jobsite, the project managers will rely on daily standup reports and weekly walkthroughs to ensure that everything is in place. But if a minor error occurs, like MEP installation missing its vertical clearance by a few centimeters, it may not be noticed until the concrete ceiling is poured. At this point, the cost of correction is not just MEP rework but also breaking into the finished concrete, coordinating multiple subcontractors, potential structural review, and a schedule impact that affects every trade thereafter. Not to mention the money it takes. Imagine how the situation could have been handled if the issue had been caught immediately, on the same day.
Clearly, construction data analytics is the rightful solution to this. Track3D captures the site at regular intervals and compares each scan against the coordinated model. The clearance issue shows up before the concrete pour. The project manager shares the raised flag with the relevant trade, and the correction is completed within a few hours. This one minor catch just saved money, schedule, and material; reduced the risk of a subcontractor dispute; and preserved the relationship between the client and the team.
Conclusion: Ready To See What Your Data Is Telling You?
After these in-depth discussions, we know how data analytics in construction can impact the jobsite. A structured collection of data can help teams increase productivity and efficiency while simultaneously reducing rework. When organized data is available to analyze, better decision-making becomes easier. In fact, construction data analytics goes one step further – it also generates useful insights from the data that the team can make use of almost immediately.
But how do you know if you need to make the shift? If your projects generate a huge amount of data, but the team is still discovering issues too late, you need to move to better data analytics. Book a demo with Track3D today and see how construction data analytics can protect your next project from the ground up.
FAQs
What is construction data analytics?
Construction data analytics is the process of collecting and analyzing project data to surface actionable insights that help teams manage quality, reduce rework, and keep projects on schedule and on budget.
How does data analytics in construction help reduce rework?
Construction data analytics helps to reduce rework by comparing as-built site conditions against the design model in almost real time. This way, discrepancies are identified early, before the work is covered, compounded, or handed off to another trade. And as all teams know, early detection makes corrections faster and cheaper.
What is Reality Intelligence in construction?
Reality Intelligence means capturing real-world site conditions digitally and automatically analyzing them against planned designs. Track3D uses Reality Intelligence to give teams a continuous, data-backed view of how construction is progressing compared to how it was designed.
Is construction data analytics only for large projects?
No, not at all! Any project where multiple trades work in parallel or sequentially can benefit from construction data analytics.
How often should site data be captured for analytics to be effective?
How often site data should be captured depends on the phase of construction and the pace of work. For example, during active structural or MEP phases, weekly or bi-weekly captures are usually sufficient to maintain a useful feedback loop. But it’s best to figure out what will work for your project beforehand, just as Track3D works with teams to define a capture frequency that fits the project schedule.