Picture this. It’s Monday morning. You open your project report and something feels off. The cost code is running hot. A trade is behind schedule. But here’s the catch. This “current” report is actually describing last week. Whatever caused that problem has already gotten worse while you were reading about it.
That’s the reality for most construction executives right now. And it’s exactly the gap a construction executive dashboard is built to close. Want to know how? Read on!
Key Takeaways
- Most executives find out about budget or schedule trouble one to two weeks after it starts.
- A construction executive dashboard pulls cost, schedule, and progress data into one live view, so no more waiting on someone to build a slide deck.
- The delay happens because field data, drawings, and cost systems don’t talk to each other, and the disconnect itself has a real dollar cost.
- The newest dashboards report what already happened and use historical data to flag what’s likely to happen next.
- Reality Intelligence platforms like Track3D improve dashboard accuracy by providing verified progress information.
Life Before a Construction Executive Dashboard
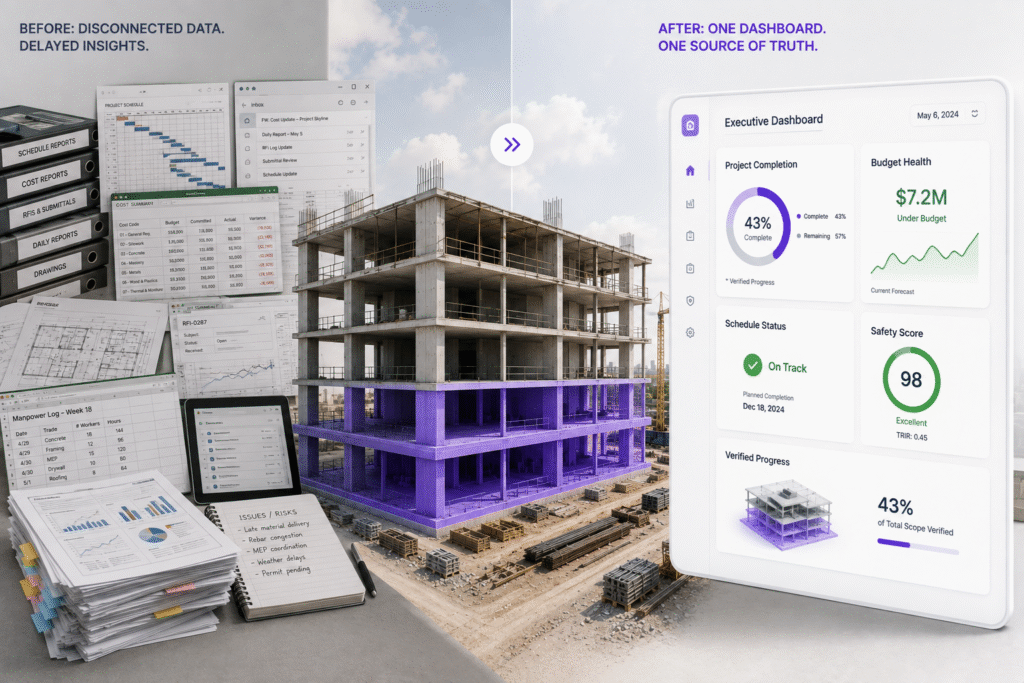
Sit in on a typical leadership meeting at a construction firm and you’ll see the same scene play out. Someone spent their morning bouncing between four different systems. The superintendent’s daily notes are in one folder. Cost figures live in the accounting software. Schedule updates sit somewhere else entirely. Somebody has to manually stitch all of it into a slide deck before anyone upstairs can even look at it.
That process eats a shocking amount of time. Pulling together a single progress report can take a team four to eight hours. And the data usually gets copied, reformatted, and touched three or four times before it’s ready to present. None of that rework builds anything. It just moves the same numbers from one spreadsheet to another.
By the time a report lands on an executive’s desk, it’s already old news.
The Real Price of Finding Out Too Late
Have you ever attended a monthly review and been surprised by a cost overrun that was not mentioned beforehand? You are definitely not the only one to be frustrated because this problem tops the list of concerns expressed by construction executives. It reveals a significant flaw in the information flow within projects.
The numbers back it up in a big way. Here are some findings from McKinsey and other reports:
| Finding | Stat |
| Average cost overrun on large capital projects | 79% above the original budget |
| Infrastructure projects (20 countries, 70 years studied) that came in over budget | 85%, averaging 28% over |
| Megaprojects over $1 billion with overruns above 30% | 98% of them |
| Average overrun on those billion dollar megaprojects | 80% over budget |
They’re not isolated cases. It’s a problem throughout the industry. Without visibility, little budget discrepancies are left unnoticed, accumulating until they turn into bigger problems. By the time they’re discovered in reports, the window to correct them becomes far too expensive.
Why This Gap Exists in the First Place
It helps to understand where this problem actually comes from. It isn’t laziness or bad management. It’s structural.
A construction project creates data in a dozen places: field logs, RFIs, submittals, drawings, BIMs, cost systems, and schedules. All these applications work effectively within their scope. The point is that none of these apps was initially created to work together, meaning that some integration efforts are required, and it must be done manually by transferring information from one app to another. And, of course, hoping nothing gets lost in translation.
This creates two problems.
- Time-consuming: Time spent on transferring data is not used for fixing the real problems on-site.
- Risky: Every copy and paste operation is an opportunity to miss something or to lose quality data.
This disconnect between systems is a documented, industry-wide cost. Research on poor data management in construction puts the global toll at roughly $1.8 trillion a year in wasted effort, rework, and bad decisions. Some studies suggest firms pulling in $1 billion in annual revenue could be quietly losing up to $165 million a year to bad data handling alone.
What is even more surprising? Some researchers estimate that less than 1% of all the data created by data construction projects is ever used for making decisions. The remaining data simply sits idle in different systems without anyone bothering to reconcile it. However, it’s not only the construction industry that faces such issues. Across industries, teams lose roughly 10 hours/week just hunting for information trapped in disconnected systems.
| Cost of Disconnected Data | Figure |
| Global losses from poor construction data management | Roughly $1.8 trillion a year |
| Potential annual loss for a $1 billion revenue contractor | Up to $165 million |
| Share of project costs tied to rework from bad data | Close to 20% |
| Hours a week employees spend searching for scattered data | About 12 hours |
Nearly a fifth of total project costs get eaten up by rework that traces back to bad or missing data. That’s real money walking out the door because two systems couldn’t share a number.
What a Construction Executive Dashboard Actually Fixes
This is exactly where a construction executive dashboard earns its place. Instead of someone manually stitching reports together, the dashboard connects straight into the systems holding your cost, schedule, and field data. It updates on its own and puts everything on one screen.
A solid construction management dashboard usually tracks:
- Project completion percentage
- Budget variance by cost code
- Labor productivity
- Safety incidents
- Overall schedule status
It can flag a red zone metric, like a slipping schedule or a cost code trending over budget, the second it happens rather than three weeks later. What used to be a half-day reporting chore turns into a two-minute check.
And here’s the real value. Catching a 5% cost variance in week two is an easy fix. Catching that same variance in month four, after it’s spread across five trades, is a much bigger headache. A good dashboard exists purely to close that timing gap.
Think about a labor productivity dip during a concrete pour. A manual report might not surface it until the monthly meeting. A dashboard pulling daily field data flags it that same week, while there’s still time to adjust crew size and actually save the schedule.
How a Construction KPI Dashboard Actually Works
Most dashboards today draw data from several sources: scheduling systems, accounting systems, field reporting systems, and also more advanced technologies such as drones, 360-degree cameras, and laser scanners. Then, the dashboard layer converts all of this raw data into graphs and other easily digestible visuals.
| Old Way: Manual Report | New Way: Live Dashboard |
| Rebuilt by hand each week | Updates automatically, all day |
| Reflects last week’s site conditions | Reflects today’s site conditions |
| Takes 4 to 8 hours to prepare | Takes minutes to review |
| One time snapshot | Continuous trend line |
| Prone to copy paste errors | Pulled straight from source systems |
A typical executive view includes project completion percentage, budget variance by cost code, safety incident trends, and current cash position, all on one screen, all current.
This is also where the smarter dashboards start pulling ahead of the basic ones. A live view of what already happened is a big improvement over a stale PDF. But the next generation of reporting goes a step further, using historical and real time data to flag risk before it even shows up as a red number on your screen.
Studies on predictive analytics in construction have found that early warning models built on project data can catch a large share of critical risks before they hit performance. Some research points to over 70% of risks flagged in advance, with lead times of several weeks. Broader estimates suggest that wider AI adoption across construction risk management could unlock over a trillion dollars in industry-wide savings a year.
In practice, that means a dashboard doesn’t just tell you a cost code is trending over budget today. It can flag that it’s likely to trend over budget next month, based on patterns pulled from thousands of similar projects. That’s the difference between checking your rearview mirror and actually turning on your headlights.
| Reporting Type | What It Tells You |
| Manual status report | What already happened, often a week or more ago |
| Live executive dashboard | What is happening right now |
| Predictive dashboard signal | What is likely to happen in the coming weeks |
Where Track3D Fits Into the Picture
Here’s the catch, though. A dashboard is only as good as the data feeding it. And that data is often the weakest link in the whole chain. Plenty of dashboards still lean on self-reported progress estimates from the field, numbers that can be a little optimistic or wildly inconsistent depending on who’s reporting them.
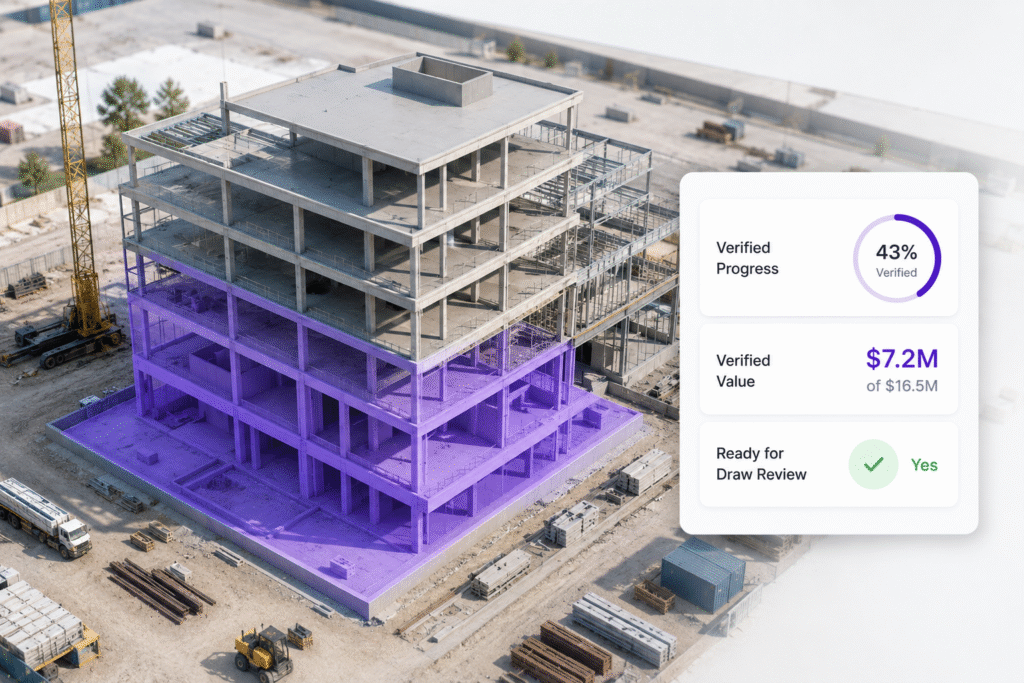
Track3D tackles that problem right at the source. Using reality capture, drone imagery, and 360-degree site scans, Track3D builds an accurate as-built record of the actual site. It then compares that record against the BIM model automatically.
So instead of a superintendent eyeballing a floor at “about 70% done,” Track3D’s Reality Intelligence measures installed quantities against the plan and produces a verified progress percentage.
That’s the number that should be feeding your executive dashboard. When the underlying data is accurate, leadership can actually trust what they’re seeing and make real calls based on it.
Getting Your Team to Actually Use It
None of this matters if your project managers and field crews never open the dashboard or don’t trust the numbers on it. This is where the majority of the vendors are silent. Research conducted by the industry on the adoption of technology in construction always comes up with the same problems: lack of IT skills, insufficient budget, and simply reluctance to change existing processes.
A few things that distinguish effective dashboards from those doomed never to be used.
| Rollout Habit | Why It Works |
| Keep the data source visible | People trust a number more when they know where it came from |
| Start with one or two metrics | Rolling out ten KPIs on day one overwhelms teams |
| Put someone in charge of it | Firms with a named owner see far better adoption than those who just hand out logins |
| Make it mobile friendly | Field teams check phones, not desktops in a trailer |
| Train crews on what to do with a red flag | A metric that turns red means nothing if nobody knows the next step |
Firms that layer in even one new digital tool tend to see a measurable bump in revenue growth year-over-year, according to industry research on technology adoption. That’s proof this is a real business lever, but only if people actually use it day to day.
Better Reporting Over Time, Not Just Today
Once a construction executive dashboard runs on accurate, automated progress data, it stops being just a snapshot of today. It starts showing you trends. A dashboard with a consistent, verified history can catch a slipping trend early, say a trade’s productivity dropping for three weeks straight, well before that slide turns into a blown milestone.
That’s the direction the whole industry is heading, away from static summaries and toward forward-looking signals that give executives a real chance to act before a problem gets expensive.
Track3D helps keep the underlying data honest. Whatever dashboard sits on top of it then actually reflects what’s happening on site, not what someone guessed was happening on site.
Common Dashboard Mistakes That Limit Value
Not every dashboard delivers the results you expect. In many cases, it all comes down to how the dashboard is designed and used.
| Common Mistake | Why It Creates Problems | Better Approach |
| Tracking too many KPIs | Important issues get buried in unnecessary data. | Focus on the handful of metrics that influence business decisions. |
| Depending only on manual updates | Information quickly becomes outdated or inconsistent. | Automate data collection wherever possible. |
| Using disconnected systems | Teams spend time reconciling conflicting reports. | Integrate scheduling, cost, and field data into one view. |
| Ignoring field adoption | Poor data quality reduces confidence in reports. | Choose tools that fit existing site workflows. |
| Reviewing dashboards only once a month | Problems continue growing between reporting cycles. | Make dashboard reviews part of regular project discussions. |
A dashboard should simplify decision-making, not create another reporting task. The most effective dashboards are the ones people actually trust and use.
When a Dashboard Alone Isn’t Enough
A dashboard, no matter how well built, can’t rescue a project with an unrealistic schedule baked in from day one, or fix a crew that was never properly trained. What it can do is surface problems clearly and early. It doesn’t replace the judgment of your project team or the need for solid planning up front. Think of it less as autopilot and more as a much better set of headlights for the road you’re already driving.
See Verified Progress Data on Your Own Executive Dashboard
If your executive reports still take a week to catch up with what’s actually happening on site, it’s worth a conversation. Connect with the Track3D team to learn more about feeding accurate, automated progress data straight into your reporting tools. Also, schedule a demo to see it in action on a live project.
Frequently Asked Questions
Q1. What is a construction executive dashboard?
A. It’s a centralized, visual reporting tool that pulls cost, schedule, safety, and progress data from across a project into one continuously updated view for leadership.
Q2. How is a construction KPI dashboard different from a regular status report?
A. A status report is a manual snapshot that may be obsolete before even being read. A KPI dashboard updates itself automatically, provides current figures, and shows trends rather than a mere snapshot.
Q3. What should executive summary reporting for construction include, at minimum?
A. Budget variance, schedule status, safety incidents, and progress against plan. More mature setups also track productivity trends and cash flow.
Q4. Can a dashboard replace project managers?
A. No. A dashboard gives project managers and executives faster, clearer information. It doesn’t replace their judgment, their planning, or their decisions made on site.
Q5. How does Track3D improve the data feeding a construction executive dashboard?
A. Track3D compares as-built site conditions against the BIM model using reality capture. That produces a verified progress percentage instead of a rough field estimate, so the dashboard on top of it is actually trustworthy.
Q6. Do dashboards work for smaller contractors, or only large firms?
A. Smaller firms benefit too, and arguably have less room for error. With tighter margins, catching a 5 percent cost variance early matters just as much, if not more, on a $2 million project as it does on a $200 million one.