Construction projects generate an enormous amount of progress information. Every site walk, field report, coordination meeting, and status update contributes another data point to understanding how a project is advancing.
Tools like Track3D’s Progress Overview help teams quickly understand current project status across levels, zones, trades, and sub-trades. This visibility is critical for monitoring completion, communicating project status, and maintaining alignment across stakeholders.
However, project teams often need more than a current status update. They also need to understand how progress is evolving.
Are crews maintaining a consistent pace?
Which trades are accelerating or slowing down?
Is work progressing in line with planned schedules?
Are certain scopes becoming bottlenecks for downstream activities?
Answering these questions requires visibility into overall trade performance, not just current progress.
This is where Track3D Progress Trends provides additional insight. By visualizing progress across multiple captures, teams can better understand productivity patterns, compare workstreams, evaluate schedule performance, and make more informed project decisions. Progress can be viewed using both percentages and exact quantities completed, providing an objective view of work installed.
Understanding Progress Over Time
Progress reporting is most valuable when teams can view both current status and historical performance together.
A project may be 65% complete today, but understanding how it reached that point often provides deeper operational insight. Has progress been steady across recent captures? Has production accelerated? Has a trade begun slowing down? These patterns often reveal risks and opportunities that are difficult to identify from a single reporting period alone.
By analyzing progress over time, teams gain a clearer understanding of project momentum and can make decisions based on trends rather than isolated data points.
This becomes particularly important on large projects where multiple trades, work areas, and construction phases are progressing simultaneously.
Revealing Productivity Patterns Across Captures
Construction productivity is rarely linear.
Production rates fluctuate due to countless factors. These changes often happen gradually, making them difficult to identify through traditional reporting methods.
Looking at progress across multiple capture periods helps teams understand how productivity is changing over time.
For example, a superintendent reviewing drywall installation may want to understand whether production has remained consistent over the past several weeks or if installation pace has begun slowing. Similarly, a project manager may want to identify periods where productivity increased significantly and understand what contributed to those improvements.
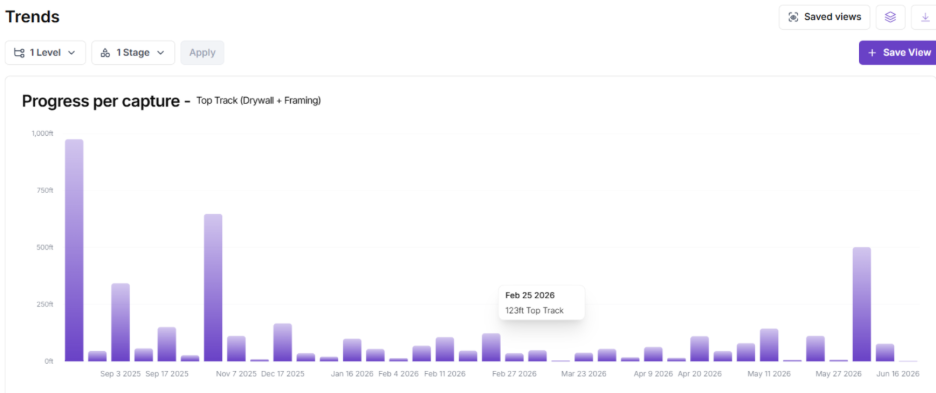
Track3D’s Progress Per Capture view helps answer these questions by showing the amount of work completed during each capture period.
By selecting a specific level or zone and focusing on a particular trade or sub-trade, teams can visualize how much work was completed between captures and identify periods of acceleration, slowdown, or consistent production, helping teams spot lagging work before it creates downstream schedule impacts.
Seeing the Bigger Picture with Cumulative Progress Trends
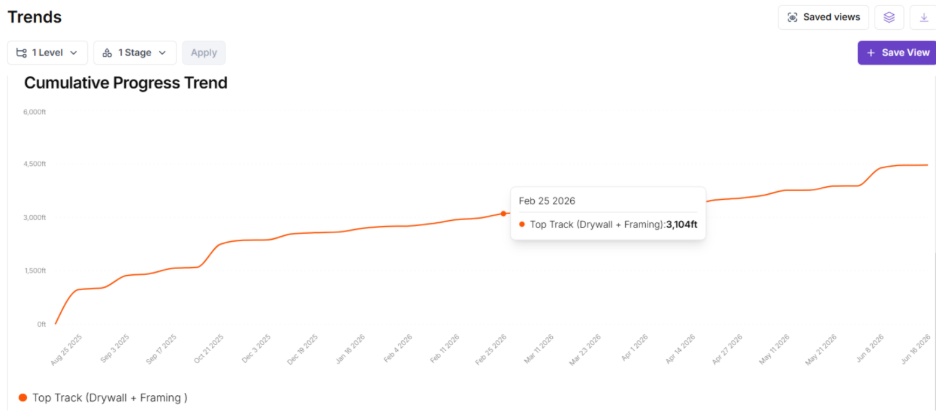
While capture-by-capture analysis helps explain short-term performance, projects also require a cumulative view of progress over time.
Track3D’s Cumulative Progress Trends provide this perspective by visualizing overall progress growth as a trend line across multiple captures. A consistent upward trajectory may indicate healthy production, while noticeable changes in trend direction can highlight emerging issues that deserve further investigation.
This historical view is particularly valuable when reviewing project performance across longer durations. It allows stakeholders to evaluate overall momentum, understand how different phases of work have progressed, and identify trends that may influence future planning decisions.
Construction projects depend on coordination between multiple trades, each progressing at its own pace and often relying on the completion of preceding work.
As projects become more complex, understanding how different scopes are progressing relative to one another becomes increasingly important.
Comparing Trades to Improve Coordination
Construction is fundamentally a coordination exercise and depends on coordination between multiple trades, each progressing at its own pace and often relying on the completion of preceding work.
As projects become more complex, understanding how different scopes are progressing relative to one another becomes increasingly important.
A trade may appear healthy when viewed independently, but comparisons often reveal a different story. One scope may be advancing significantly faster than another, creating potential handoff challenges, exposing downstream schedule risks, or indicating that prerequisite work may not be progressing quickly enough for upcoming trade handoffs.
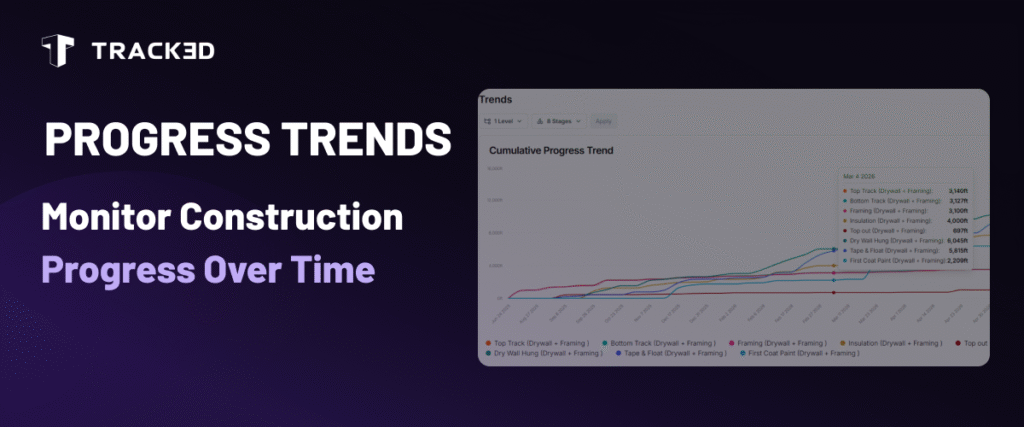
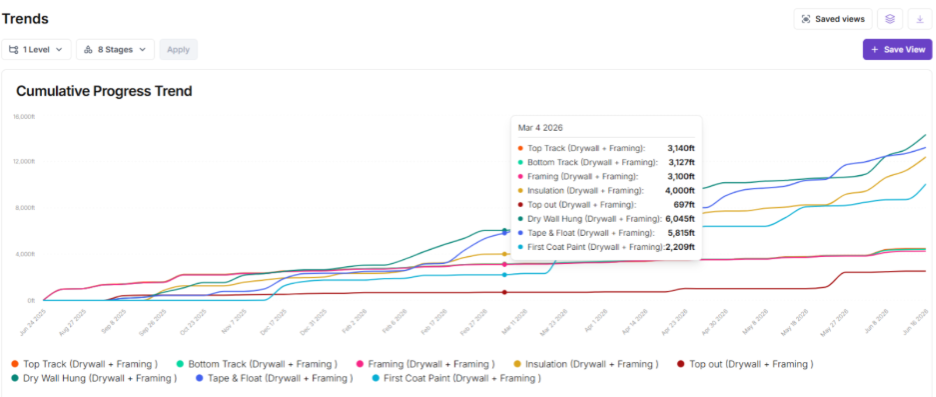
Track3D allows teams to compare multiple trades or sub-trades within a selected level or zone using a single trend chart.
Each selected scope appears as its own trend line, making it easy to compare performance across different workstreams.
For example, teams can compare Drywall, Ceilings, and Paint activities within the same level to understand how each trade is progressing relative to the others. Similarly, they can compare drywall sub-trades such as Top Track, Bottom Track, and Stud Installation to better understand sequencing and execution performance.
Understanding Progress in the Context of the Schedule
Perhaps the most valuable question a project team can ask is not “How much work is complete?” but “Are we progressing at the pace required to achieve our goals?”
This is where schedule-based progress analysis becomes particularly valuable.
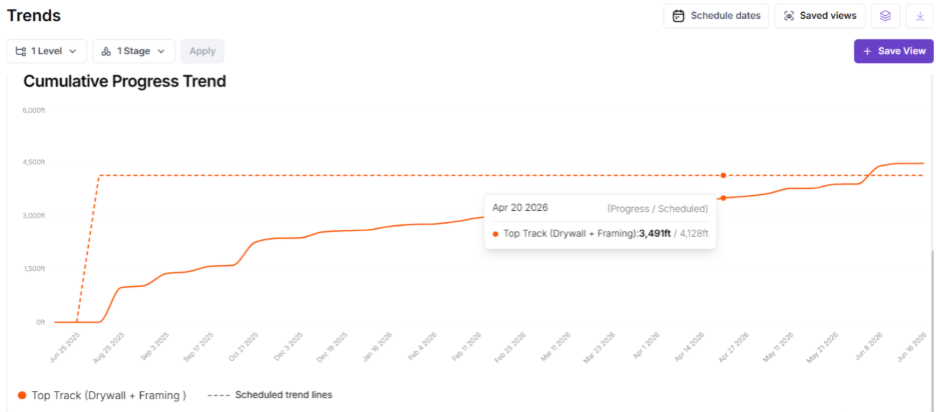
When actual progress is viewed alongside planned progress, teams gain immediate visibility into whether work is tracking according to expectations. Divergence becomes easier to identify, and potential risks become visible earlier in the project lifecycle.
Track3D’s Schedule Trend Lines overlay planned progress against actual progress, helping teams understand whether production is keeping pace with project objectives.
The planned schedule can come from an uploaded project schedule or temporary target dates defined directly within Track3D. This flexibility allows teams to evaluate both current performance and alternate completion scenarios without disrupting existing schedule data.
Instead of waiting for a missed milestone to reveal a problem, teams can identify deviations as they begin to emerge and take corrective action sooner.
Supporting Better Project Coordination
Progress discussions are a central part of construction project management.
Owners, project managers, superintendents, field engineers, subcontractors, and executive stakeholders all rely on progress information to make decisions and coordinate work.
Track3D trend data adds valuable context to these conversations.
Instead of relying solely on current progress values or anecdotal observations, teams can reference visual performance trends that show exactly how work has progressed over time.
This creates more productive discussions around productivity, schedule performance, resource allocation, trade coordination, and project risk.
To support these workflows, Track3D allows trend configurations to be saved as Saved Views, making it easy to return to frequently used levels, trades, and comparisons without rebuilding filters each time. Teams can create views tailored to their responsibilities, set up default views for quick access, and share them with other users or groups to maintain alignment across coordination meetings and progress reviews.
Trend data can also be exported directly into PDF and Excel reports. Teams can easily incorporate visual trend charts and supporting data into coordination meetings, owner updates, progress reviews, pay application discussions, and project documentation.
By making historical performance easier to understand and share, teams can improve communication and drive more informed decision-making across the project.
To see how Progress Trends can help your team understand productivity, schedule performance, and trade coordination:
➜ Explore Track3D’s automated progress tracking solution
➜ Request a demo to see ProgressTrack in action on your projects