
Construction KPIs are the metrics teams use to track cost, schedule, quality, safety, and financial performance on a project. Reliable construction project KPIs identify problems early, before they escalate into schedule delays or budget overruns. Not every metric a team tracks meets that bar.
Key Takeaways
- Construction KPIs fall into five categories: schedule, cost, quality, safety, and financial health.
- Schedule Performance Index (SPI) and percent complete are the two most widely used progress metrics.
- Rework typically costs 2 to 6% of total project value and is largely preventable (CII, via DiscountPDH).
- 98% of North American construction projects exceed their original schedule (Buildern, 2025).
- This guide covers all 15 KPIs, but the most valuable construction performance metrics are the ones that surface an issue while it is still inexpensive to correct.
What Are Construction KPIs?
A construction KPI, or key performance indicator, is a specific, measurable data point tied to a project or business goal, such as cost per square foot, schedule variance, or defect rate. Teams track these metrics over time to evaluate whether performance is improving or declining. A construction KPI is only as reliable as the data behind it. A well-structured metric built on outdated field data still functions as a lagging indicator, regardless of how the dashboard presents it.
Most construction firms track a combination of financial metrics (net income, cash position, DSO, budget accuracy), operational metrics (labor productivity, equipment downtime, submittal turnaround), and quality and safety metrics (incident rates, rework, first-time quality, punchlist completion). The common failure point is not tracking too few KPIs. It is tracking too many without agreement on which ones should drive a decision.
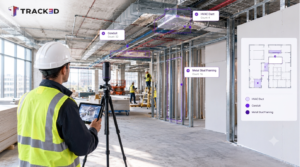
[Construction progress is reviewed on a tablet displaying project performance metrics, with an active jobsite in the background supporting real-time decisions.]
Why Construction KPIs Matter
Industry data illustrates the scale of the problem. Only about 8.5% of construction projects finish on time and within budget, according to Elevate Constructionist’s analysis of industry delivery data. Average schedule overruns run 37% past the original timeline. Budget overruns affect roughly 90% of all projects, averaging 28% over the original estimate, per Cylinders Inc.
These figures represent the industry baseline, not an exception. Why do the same failure patterns recur across projects? In most cases, teams do not identify a schedule slip or quality issue until weeks after it begins, once correction costs have already multiplied. Construction KPIs are designed to close that gap between when a problem starts and when a team detects it.
Schedule KPIs for Construction Projects
1. Schedule Performance Index (SPI)
Schedule Performance Index (SPI) compares actual project progress to planned progress. It is calculated by dividing earned value by planned value, where a result below 1.0 indicates the project is behind schedule. An SPI of 0.85, for example, means a team has completed 85% of the work it should have finished by that point. SPI is only as current as the most recent progress update, which for most teams is a weekly or biweekly reporting cycle.
2. Percent Complete
Percent complete measures the proportion of a defined scope of work, an activity, a trade, or an entire project, that has been physically installed or finished at a given point in time. In practice, this metric is applied inconsistently. Different reviewers frequently assign different values to the same work, since “complete” is interpreted differently depending on who is assessing it and what standard they are applying.
3. Installation Pace vs. Plan
Installation pace vs. plan tracks the actual rate of work, for example, linear feet of drywall installed per week, against the planned rate. Unlike SPI, this metric can be measured continuously rather than at fixed reporting intervals. If a crew installs 750 linear feet against a 1,000-linear-foot weekly plan, that gap is an early warning signal, visible well before it appears as a schedule variance in a monthly report.
Cost Performance Metrics in Construction
4. Cost Performance Index (CPI) and Budget Variance
Cost Performance Index (CPI) compares the value of completed work to the amount spent to complete it. A CPI below 1.0 indicates the project is spending more than the value of the work delivered. Budget variance is a related metric, calculated as planned cost minus actual cost and tracked by activity. Both metrics indicate that costs are drifting, though neither explains the underlying cause.
5. Rework Cost Rate
Rework cost rate measures the percentage of total project cost spent redoing work that did not meet specifications on the first attempt. It is one of the most consistent sources of margin loss in construction. Direct rework costs average approximately 5% of total construction spend, according to research compiled from the Construction Industry Institute, with rates reaching 9.3% on light industrial projects. On a $50 million project, a 5% rework rate equals $2.5 million in avoidable cost.
6. Labor Productivity
Labor productivity compares planned labor hours for a scope of work to actual hours spent completing it. Because labor is typically the largest controllable cost on a project, this metric has significant influence on margin. Tracking labor productivity by activity, rather than at the whole-project level, allows teams to adjust crew sizes during execution instead of explaining variances after the work is complete.
Quality Control KPIs for Construction Teams
7. First-Time Quality Rate
First-time quality rate measures the percentage of installed work that passes inspection without correction. It functions as the inverse of rework cost rate: rework cost quantifies the financial impact of errors, while first-time quality quantifies how often those errors occur. Tracking this metric by trade and by crew helps teams identify patterns, such as a subcontractor whose first-pass rate declines during extended shifts.
8. Punchlist Completion Time
Punchlist completion time measures the duration required to close outstanding minor defects identified near project completion, from the date the list is generated to verified resolution of every item. An expanding punchlist after closeout typically indicates that quality checks occurred too late in the sequence to catch issues while they remained inexpensive to correct.
Safety KPIs for Construction Projects
9. Lost Time Injury Frequency Rate (LTIFR)
LTIFR is a safety KPI calculated as total injuries multiplied by 1,000,000, divided by total hours worked. This produces a standardized rate that allows comparison across projects of different size and duration. Because LTIFR is a lagging indicator, it should be paired with leading indicators such as near-miss reporting and safety observation rates.
Coordination and Documentation KPIs
10. Change Order and RFI Volume
Change order and RFI (Request for Information) volume tracks how frequently project scope shifts after contract award, and how quickly the resulting questions are resolved. An increase in RFI volume is not inherently negative. It may indicate incomplete drawing coordination, or it may reflect the complexity of the project itself.
11. Submittal Turnaround Time
Submittal turnaround time measures how long shop drawings, product data, and material samples take to move through review and approval. Delayed submittals are a common, and frequently overlooked, cause of schedule slippage, since the delay typically occurs off-site during design review rather than in the field. Tracking this metric identifies bottlenecks in the design team’s response time, separate from contractor field performance.
Financial and Business Performance KPIs for Contractors
12. Days Sales Outstanding (DSO)
Days Sales Outstanding (DSO) measures the average number of days required to collect payment after invoicing. It directly affects a contractor’s available cash for payroll, materials, and subcontractor payments. Industry benchmarking data compiled by Premier Construction Software places average collection periods at approximately 58 days. Given standard retainage terms and 60- to 90-day payment cycles in construction, DSO functions as an indicator of business health, not only project health.
13. Equipment Utilization and Downtime Rate
Equipment utilization rate measures the proportion of an asset’s available working time spent in active use, versus idle due to breakdowns, weather, or scheduling gaps. Downtime is measured in hours or dollars lost per incident. Published analyses indicate that pairing utilization data with predictive maintenance can reduce downtime by up to 40%, though the actual figure depends on fleet age and maintenance program maturity.
14. Estimate Accuracy
Estimate accuracy compares a project’s original bid or budget to its final actual cost, expressed as a percentage variance. This metric has significant influence on long-term company performance: a firm winning every bid it submits can still face financial strain if its estimates consistently run low. Tracking estimate accuracy across projects, rather than within a single project, converts it into a feedback loop for future bids.
15. Bid-to-Win Rate
Bid-to-win rate measures the percentage of submitted proposals that convert into awarded contracts. It serves as a leading indicator of pricing competitiveness and sales pipeline health. A low win rate does not necessarily indicate a problem; it may reflect disciplined bidding on higher-margin work. A high win rate combined with thin margins, however, often signals underpricing to secure volume.
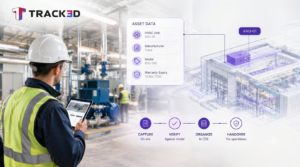
A constructionperformance dashboard visualizing key project metrics, enabling real-time tracking of schedule, costs, productivity, and quality.
How Teams Actually Track These KPIs
Most of these metrics have historically depended on manual site walks, field notes, and spreadsheet reconciliation against the prior week’s data. This process is functional but slow, and a delayed metric provides limited value as a leading indicator. A schedule variance identified two weeks late no longer serves as an early warning.
Reality capture and Reality Intelligence platforms, such as Track3D, are designed to close this gap. Instead of a superintendent manually estimating percent complete from memory and photos, AI-based progress quantification measures installed quantities directly from 360-degree walks or drone captures and compares them to the schedule automatically. In one deployment example from Track3D’s case data, teams reported a 12% improvement in schedule adherence and identified issues one to two weeks earlier than their previous manual process, with rework costs down approximately 20% from baseline. On a Hensel Phelps airport project, consolidating five separate documentation tools into one platform saved close to 3,000 labor hours over the course of the job.
“We used to spend 20 hours a week just trying to verify progress. With Track3D, it’s down to an hour. We’re not chasing trades anymore, we’re making decisions,” said Garin Anderson, Area Superintendent at Hensel Phelps.
Common Mistakes Teams Make With Construction KPIs
Tracking lagging indicators only. Net income and final rework cost describe what has already occurred. On their own, they provide limited ability to prevent similar outcomes. Pairing them with leading indicators, such as installation pace and RFI trends, allows teams to act before an outcome is finalized.
No peer benchmarks. A 3% cost overrun appears unfavorable in isolation. Measured against an industry average overrun of 28%, it represents a strong result. Without a benchmark, teams often overreact to normal variance or underreact to a genuine problem because it does not appear unusual.
Too many KPIs without a clear owner. A metric with no one responsible for acting on it functions as a vanity measure rather than a management tool. A small set of metrics reviewed consistently delivers more value than a large set tracked without accountability.
Stale or manually reconciled data. A KPI is only as reliable as its input. When percent complete is based on a superintendent’s recollection of a site walk from several weeks earlier, the resulting figure functions closer to an estimate than a measurement.
Want to See Your Real Numbers?
If a KPI dashboard is only as current as last week’s site walk, it is worth evaluating what a same-day view of progress would change. Talk to the Track3D team about how Reality Intelligence applies to your next project.
Frequently Asked Questions
What are the most important construction KPIs to track?
Schedule Performance Index, percent complete, Cost Performance Index, and rework cost rate cover the majority of day-to-day project needs. Labor productivity and LTIFR are additional priorities for teams managing crews and safety directly.
How is Schedule Performance Index calculated?
SPI equals earned value divided by planned value. A result under 1.0 indicates the project is behind schedule; a result over 1.0 indicates it is ahead of schedule.
What percentage of construction projects finish on time?
Approximately 8.5% finish both on time and within budget, based on Elevate Constructionist’s review of delivery data. Median delays on projects that slip exceed 200 days.
Why do construction KPIs often lag reality?
Progress data for most teams still originates from manual site walks, photos, and spreadsheets, which can take days or weeks to compile and reconcile against the schedule.
Can software improve construction KPI accuracy?
Yes, when the software measures installed quantities directly rather than relying on manual estimation. This is the underlying principle of Reality Intelligence platforms, which quantify progress from site captures rather than field estimates.
Do construction companies need to track all 15 of these KPIs?
No. Most teams select five to eight KPIs based on role. A project manager typically prioritizes SPI, percent complete, and RFI cycle time, while a CFO prioritizes DSO, estimate accuracy, and cash position. Tracking all 15 without clear ownership for each recreates the same problem as an unused dashboard.