
The weekly report puts the Level 3 drywall at 62% complete, right where the project schedule says it should be. The labor report disagrees. The crew has already used 80% of the hours budgeted for that scope, and the finish date is now at risk even though the progress chart still looks fine.
That gap sits between progress and productivity. Construction progress tracking helps teams track progress against the plan. Construction productivity tracking measures how much labor it took to put that work in place, and whether the crew can keep that pace through the rest of the scope.
As per the Federal Reserve Bank of Richmond, construction labor productivity fell by more than 30% from 1970 to 2020. Productivity across the overall U.S. economy doubled over the same 50 years.
Key Takeaways
- Construction productivity tracking compares installed output with labor hours. Progress tracking compares installed output with the schedule.
- Progress shows where the job stands. Productivity shows whether the current pace will finish it on budget.
- Production rate, performance factor, and earned hours are the core metrics, and all three depend on verified installed quantities.
- Tracking by trade and zone exposes slow areas that a project average hides.
- Visual site capture shortens the time between a pace drop and a correction. It does not replace timecards or the superintendent’s judgment.
What Is Construction Productivity Tracking?
Construction productivity tracking is the practice of measuring installed work against the labor hours used to install it, by trade, zone, and time period. The goal is to catch a slowing pace before it becomes a schedule or budget overrun.
The math is simple. Divide the installed quantity by the labor hours it took, and a concrete crew that places 120 cubic yards of concrete in 80 labor hours runs at 1.5 cubic yards per labor hour.
On its own, that number says very little. The estimate already carries a budgeted unit rate for every scope, and the useful question each week is how far the actual rate sits from that budget.
How Is Productivity Tracking Different From Progress Tracking?
Both draw on the same field data. They answer different questions.
| Progress Tracking | Productivity Tracking | |
| Core question | How much work is in place? | How much labor did that work take? |
| Unit | Percent complete, quantities installed | Units per labor hour, performance factor |
| Compared against | Project schedule | Estimate and labor budget |
| Main users | Owners, PMs, schedulers | Superintendents, PMs, project controls |
| Early warning | A zone falls behind its dates | A crew uses hours faster than it installs work |
So why track productivity if the schedule looks healthy? Because a project can hit every milestone and still lose its margin. When a general contractor adds a second crew to protect a date, the progress line stays on target while the labor cost per unit climbs, and the overrun appears only when the job closes out.
The pillar guide on construction progress tracking covers the schedule side in more depth.
Why Construction Productivity Tracking Matters Now
Crews are harder to find than they were five years ago. As per the AGC and NCCER 2025 Workforce Survey, 92% of construction firms report difficulty hiring for open positions.
The same survey ranks worker shortages as the leading cause of project delays, cited by 45% of responding contractors.
Federal numbers point in the same direction. The U.S. Bureau of Labor Statistics reports that productivity in highway, street, and bridge construction declined every year from 2021 to 2025. With fewer workers available, each labor hour has to carry more of the schedule, and a superintendent needs to know early whether the current crew can finish a scope. That answer shapes construction workforce management decisions well beyond a single scope.
Which Construction Productivity Metrics Should Teams Track?
Six metrics cover most commercial projects.
| Metric | How It Works | What It Tells the Team |
| Production rate | Installed quantity ÷ labor hours | Actual crew output per hour |
| Performance factor (PF) | Earned hours ÷ actual hours | Above 1.0 is ahead of budget, below 1.0 is behind |
| Earned hours | Installed quantity × budgeted hours per unit | The labor value of the work in place |
| Quantity installed per capture | Change in installed quantity between site captures | Short-interval pace by trade and zone |
| Rework hours | Hours used to remove and reinstall work | Labor that produced no net progress |
| Direct work time | Share of shift time on installation | How much of the day crews work on the tools |
The Construction Industry Institute defines direct work time, also called tool time or wrench time, as the time craft workers devote to actual construction.
A common assumption is that low output means a slow crew. More often the crew is waiting on material or on access to the next area, and the productivity number reflects a planning problem that started in the trailer.
How to Track Construction Productivity, Step by Step
The same loop applies to almost every scope.
- Set budgeted unit rates from the estimate, such as hours per 100 linear feet of drywall or per 10 cubic yards of concrete.
- Break the scope into zones and trades, and assign quantities to each level so output can be compared by location.
- Measure installed quantities on a fixed cadence, weekly or at every capture cycle, using the same method each time.
- Pull actual labor hours for the same zone and period from timecards and the construction daily log.
- Calculate production rate and performance factor, and flag any scope that falls below an agreed threshold.
- Adjust crew size or sequence, then send the final rates to estimating for the next bid.
A Worked Example
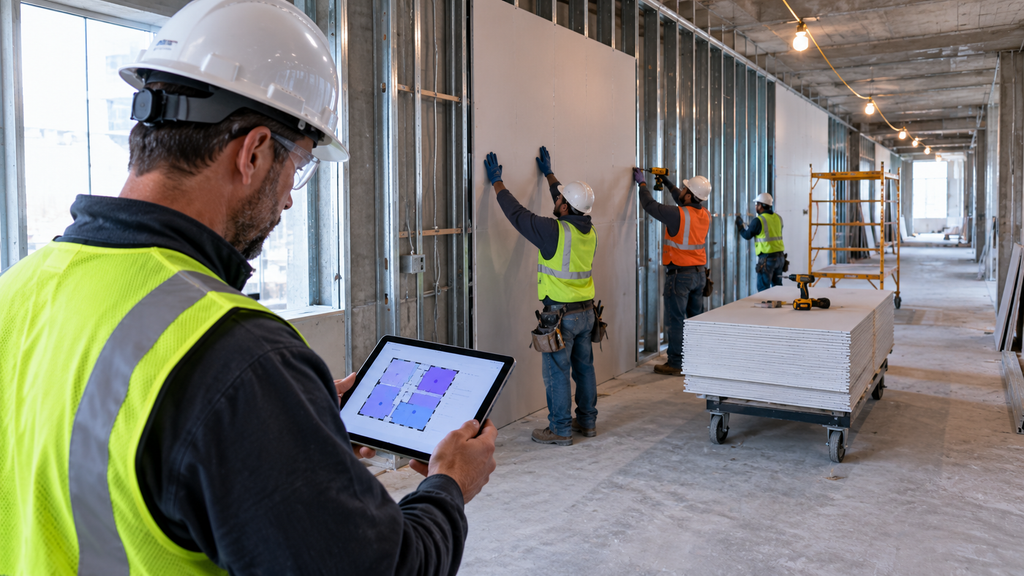
A sample in Track3D’s Reality Intelligence whitepaper describes a drywall scope planned at 1,000 linear feet per week that installs 750. The labor figures below are illustrative. Assume a four-person crew works 160 labor hours that week. At the planned rate of 6.25 LF per labor hour, those 750 feet are worth 120 earned hours. Divide 120 by 160 and the performance factor comes out at 0.75. In plain terms, the crew earns three hours of budgeted work for every four it works. The whitepaper’s superintendent catches the shortfall in the first capture cycle and adds one crew for two weeks, and the area still finishes on schedule.
Common Construction Productivity Tracking Mistakes and How to Fix Them
Relying on Self-Reported Percent Complete
Ask two foremen how far along a floor is and the answers will rarely match. Measured counts or visual records give a number that holds up in a pay application review.
Tracking Only at the Project Level
A project average can look acceptable while one zone runs two weeks behind. Tracking by trade and zone mirrors how a superintendent actually sends crews, a point covered in this look at zone readiness and project visibility.
Measuring Hours Without Quantities
Labor reports record the hours a crew used.
They do not record what the crew installed, and they rarely separate rework hours from new work. Pair every hours figure with an installed quantity and log rework on its own line.
Manual vs. Automated Productivity Tracking: Tools and Tradeoffs
| Approach | Strengths | Limitations |
| Timecards and spreadsheets | Low cost, familiar to every team | Quantities are often estimated, and updates lag by weeks |
| Daily logs and field reports | Record crew size, hours, and conditions | Quality depends on the author |
| 360 and aerial site capture with AI quantification | Measured quantities by zone, close to real time, with visual records | Requires a capture routine and a schedule baseline |
| Sensors and equipment telematics | Precise equipment hours and location data | Covers equipment better than installed work |
Ground-level capture has historically stopped at eye level, which makes overhead MEP and high-bay areas hard to quantify. Aerial 360 capture documents those spaces before the ceilings close, so work above the grid can enter the productivity record too.
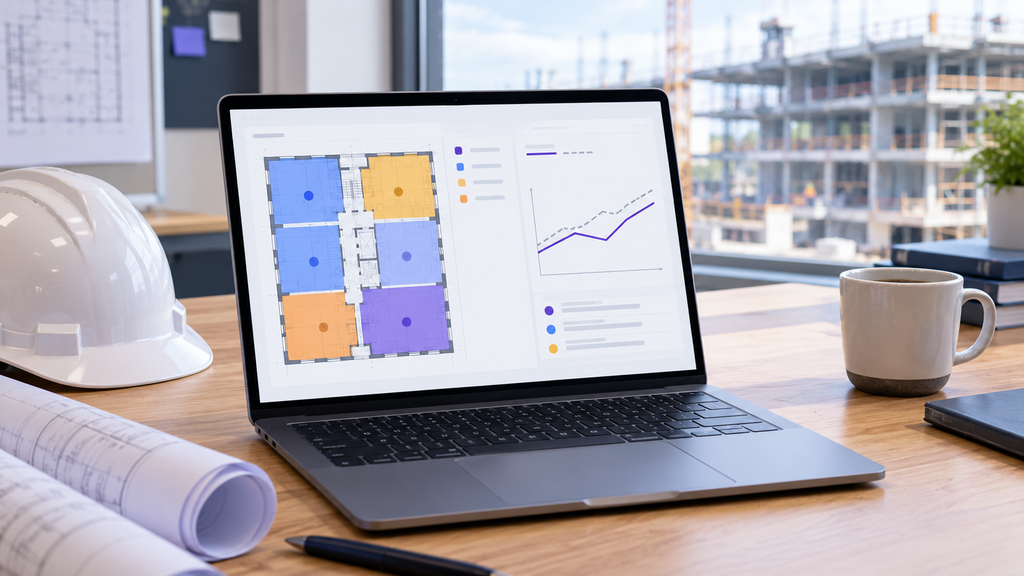
Track3D’s Progress Trends view converts site captures into quantity installed per capture for each trade and zone, with planned trend lines laid over actual output. Project managers pair that pace data with labor hours from their own timecard systems to calculate production rates in near real time.
When Automated Productivity Tracking Is Not a Fit
A small tenant improvement with two trades and a six-week duration rarely needs more than a spreadsheet and a daily log. Early sitework often tracks better with survey data and equipment telematics. And a team without a schedule or estimate baseline has nothing to measure against yet, so the baseline comes first.
What Good Productivity Data Looks Like on a Live Project
On an aviation project at San Francisco International Airport, Hensel Phelps saved 2,964 hours and $342,000 in labor costs by replacing repeated manual job walks with consolidated site capture. Garin Anderson, Area Superintendent at Hensel Phelps, said the change let his team stop documenting everything by hand and focus on the work itself.
Turning Productivity Data Into Earlier Decisions
A crew that uses hours faster than it installs work rarely appears in a progress report until the labor budget is gone. Track3D measures installed quantities by trade and zone at every capture, so project managers can compare real output against the plan while there is still time to adjust the crew.
Frequently Asked Questions
What Is Construction Productivity Tracking?
It is the practice of measuring installed work against the labor hours used to install it, by trade, zone, and week. Progress tracking, by contrast, compares installed work with the schedule.
How Do You Calculate Labor Productivity in Construction?
Divide installed quantity by labor hours. For example, 1,200 linear feet of conduit installed in 100 labor hours equals 12 linear feet per labor hour, which the team then compares with the budgeted rate from the estimate.
What Is a Good Performance Factor in Construction?
Anything at or above 1.0. Many project controls teams also set an internal trigger, such as a factor below 0.9 for two consecutive weeks, before a field review. The right threshold varies by scope and contract.
How Often Should Teams Measure Construction Productivity?
Weekly, on most commercial projects. Fast-moving scopes such as drywall or overhead MEP rough-in benefit from tracking at every site capture, because a monthly review usually arrives after the trade has left the floor.
What Causes Low Productivity on Construction Sites?
Waiting is the most common cause, whether for material, information, or access to a work area. Trade stacking and rework also cut output. When one zone runs slow and the others hold pace, the cause usually sits in that zone’s readiness rather than with the crew.